Implementing predictive learner analytics in your product with Predicted Score
 Looking for the technical specs on the Predicted Score API Endpoint?
In this section:
The Predicted Score analytic answers the question “what score would the student achieve on an exam given today, covering specific sets of learning objectives.”
It can be used to:
Predicted Score leverages
The partner application can specify multiple confidence levels C. For each such C, we’ll return a predicted score value S, which is the score at which the model thinks the student has probability C scoring below (and thus probability 100 - C scoring above). This supports a variety of use cases including displaying probability bands for the score, as well as more simple representations such as point estimates (see examples at the end of the document).
Since Predicted Score represents the likelihood of a student achieving a certain grade, by definition it never reaches 100%. However, the partner application can choose to bin or round the resulting value.
Having a forgetting curve means that the student performance will degrade over time to a certain lower-bound if the student does not work on a particular LO. The limit is data-driven and varies for different LOs.
learning_objective_coverage_requirement in predicted score requests and receive learning_objective_coverage metrics to gate their frontend behavior.Depending on the following request characteristics, Predicted Score’s response times may range from a few milliseconds to over a second.
| Request Characteristic | Impact on Response Time |
|---|---|
| Number of accounts requested | Scales linearly with number of accounts |
| Number of learning objectives requested per group | Scales quadratically with number of LOs in each group |
| Overall score requested (get_overall_score = True) | Scales quadratically with number of LOs across all groups |
| Individual scores requested (get_learning_objective_scores = True) | Scales linearly with number of LOs |
| Number of confidence levels requested | Very low impact |
| Different values for learning objective weights | No impact |
Note that requesting the same number of LOs broken down into multiple groups will generally be faster than requesting all LOs in a single group. As a best practice, if you only care about individual LO scores, form the request so that each LO is in its own group and set get_learning_objective_scores = false and get_overall_score = false.
Due to the wide variety of use cases that Predicted Score supports, our default rate/entity limits may not work for your application. If your requests will be well below our established entity limits, we may be able to raise your rate limit. Conversely, if you require significantly higher entity limits, we may be able to raise your entity limits and lower your rate limit. Reach out to your Knewton representative to discuss alternatives if your use case requires it.
While UX implementations of the analytics can vary, predicted score should not:
For these use-cases, use the Status & Progress analytic instead.
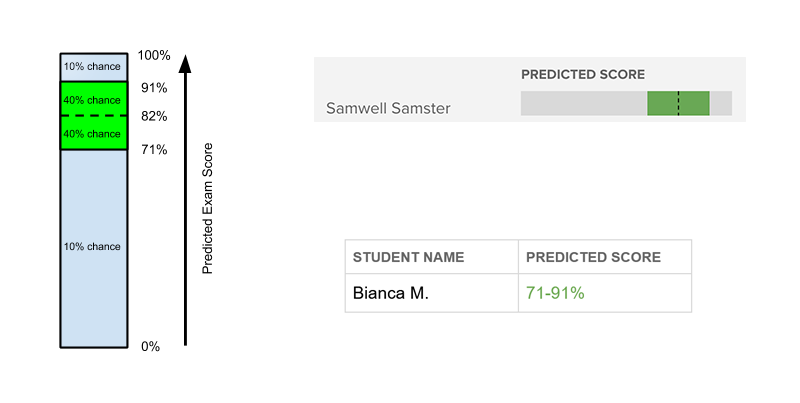
Here is an example where the partner requests the predicted score on a group of LOs at the 10th, 50th, and 90th “confidence levels”. The API might return the following predicted scores: {10: 0.71, 50: 0.82, 90: 0.91}. These scores can be used to create the following in-product displays:
 Example UI: Predicted Score on an Upcoming Exam
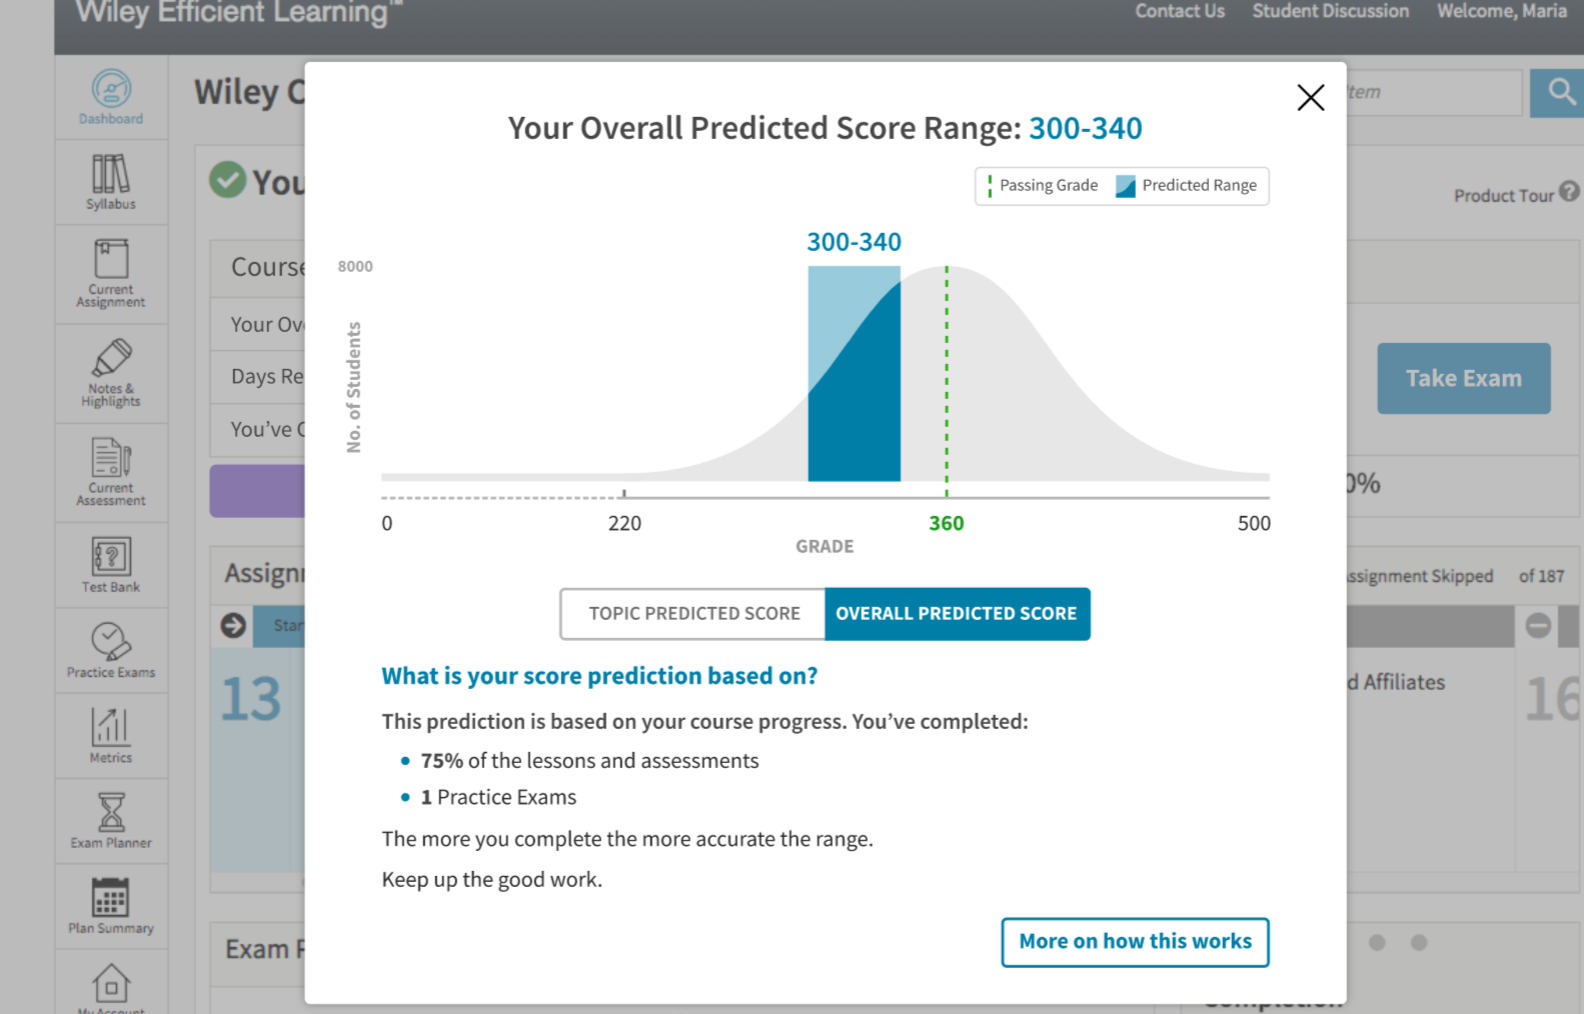
Display Predicted Score as a visual range for single student on exam. In this example, the call could have the confidence levels 10, 50, and 90 resulting in a band that represents the student’s Predicted Score with a confidence of 80%.
Display Predicted Score as a numeric range.
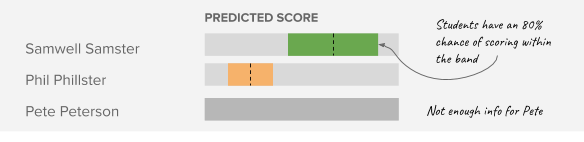
Display class-wide predicted scores for students on exams, binned into groups. Each student could be binned into a group in several different ways – most simply, using the point value of PS at some confidence (50 for median, 30 for more conservative). Or perhaps you might want to also include a “not enough info” bin if the difference between the score at confidence 80 and score at confidence 20 is too large.
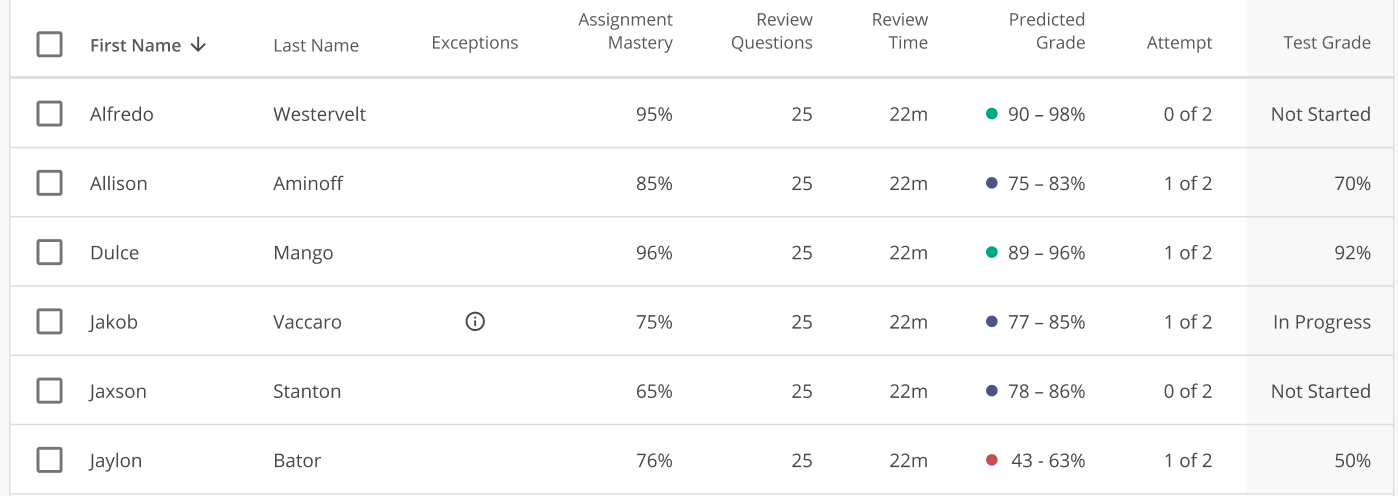
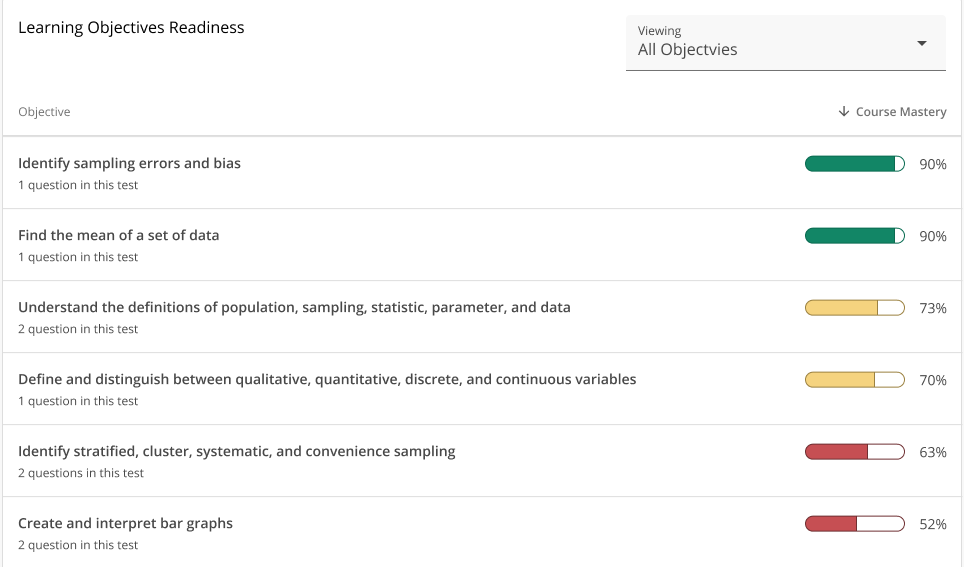
Display per-student or class-wide “overall course mastery” on LOs (or aggregations of LOs into topics or chapters). One way to achieve this is by using just a single confidence level (50 for median value, 30 to be more conservative) with get_learning_objective_scores set to true, and displaying the scores for each LO averaged across all students. The display below might have clickable “Review Now” buttons.
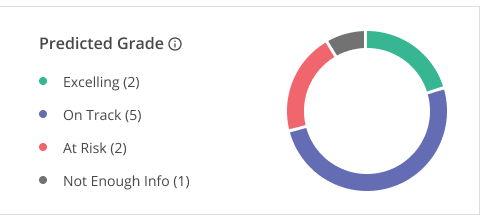
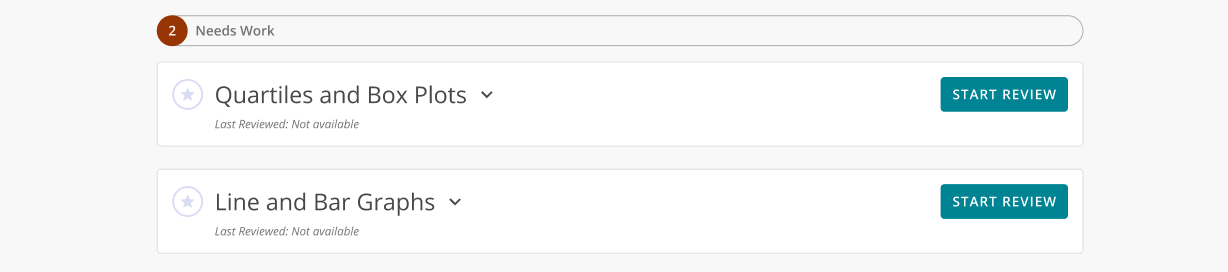
Request Predicted Score for different groups of learning objectives representing different topics/chapters. Bin the Predicted Score for each group of learning objectives into different buckets (e.g. “Needs Work”, “In Progress”, “Looking Good”).
Display the student’s Predicted Score as a range. The distribution curve is created by the app, based on historical data.
The Predicted Score API will return scores regardless of whether any given student has done work on any given LO included in the request. The partner may decide not to show predictions to users unless the student has done some minimum amount of work on a sufficient number of learning objectives across their entire usage of the app. This can be accomplished by specifying a learning objective coverage requirement and making use of learning objective coverage metrics returned with the predicted scores.
Knewton’s Predicted Score API will return a number between 0.0 and 1.0 to describe the proportion of the partner’s specified learning objective coverage requirement a given student has completed on each learning objective. Partners can use this coverage metric to gate learning-objective-level score prediction displays in their app, choosing instead to display an “insufficient data” label or icon, where appropriate.
The Predicted Score API also handles aggregation of the coverage metric across learning objectives in a group or across an exam as a whole: if, for example, a student has covered only 50% of the learning objectives on an exam to an extent sufficient to satisfy the partner’s coverage requirement (either by covering half the relevant learning objectives completely, or by covering all of the relevant learning objectives incompletely), the partner can use the returned overall learning objective coverage of 0.5 to decide whether or not to display the overall predicted score.
Predicted Score and Status & Progress work very well together! Predicted Score is meant to give a high-level view of how we think a student would perform if assessed on some learning objectives, right now, given their whole history in a course. Progress is meant to provide a self-contained view of the progress that a student is making towards demonstrating mastery on a particular assignment.
Key differences are:
Getting Started
Working with Adaptive Assignments
Predictive Learner Analytics
General API Usage
Brand Guidelines
Glossary